Cyprus – CY00
EU regions: Cyprus > Cyprus > Cyprus
| Indicator | Period | Value |
|---|---|---|
| Life long learning | ||
| life long learning participation | 2023 | 11 |
| Part time jobs and flexible employment | ||
| percentage of part time workers | 2022 | 9.76 |
| percentage of part time workers, men | 2022 | 7.76 |
| percentage of part time workers, women | 2022 | 12.02 |
| Gender differences | ||
| gender gap in employment rate | 2023 | 89.66 |
| gender gap in unemployment rate | 2023 | 103.33 |
| Graduates and young people | ||
| unemployment rate of youth with elementary education | 2023 | 24.7 |
| NEET | 2023 | 11.9 |
| Gross domestic product | ||
| GDP per capita in PPS of EU average | 2022 | 94 |
| Employment | ||
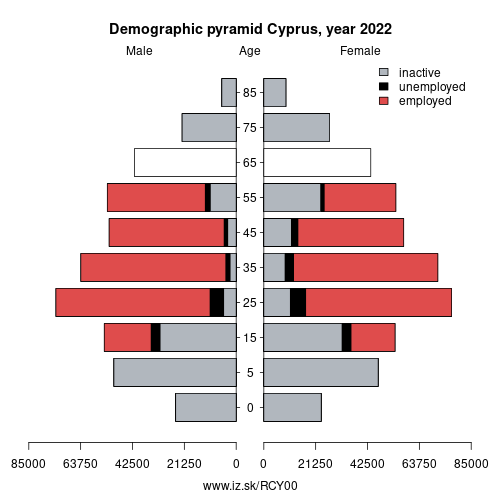
| employment rate | 2023 | 74.1 |
More on wikipedia wikidata Q229 on OpenStreetMap Cyprus slovensky: CY00
Subregions: Κύπρος
Unemployment
| Indicator | Period | Value |
|---|---|---|
| Unemployment | ||
| unemployment rate | 2023 | 6.2 |
| youth unemployment rate | 2023 | 16.9 |
| Long term unemployment | ||
| long term unemployment | 2023 | 1.9 |
| share of long term unemployed | 2023 | 31 |
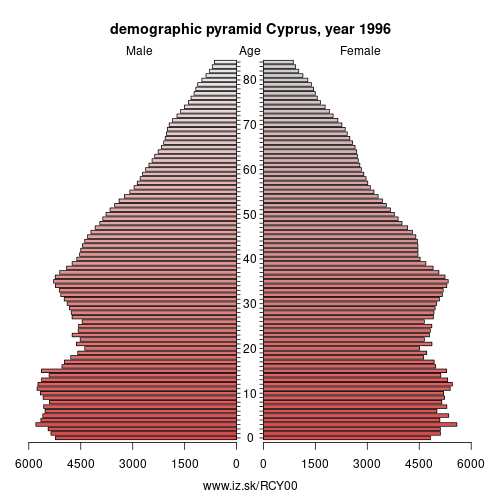
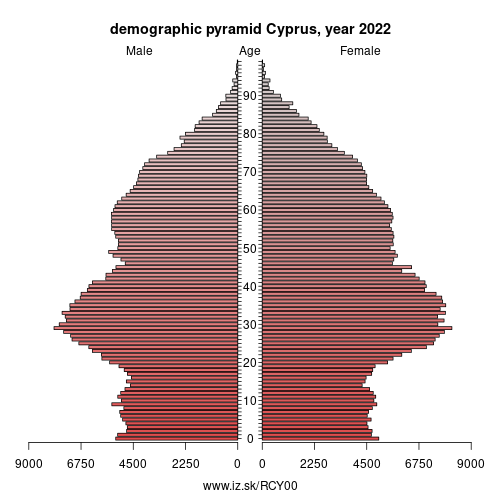
Demographics
| Indicator | Period | Value |
|---|---|---|
| Demographics | ||
| number of inhabitants | 2023 | 920 701 |
| population density | 2022 | 99.1 |
| old-age dependency ratio | 2023 | 24.7 |
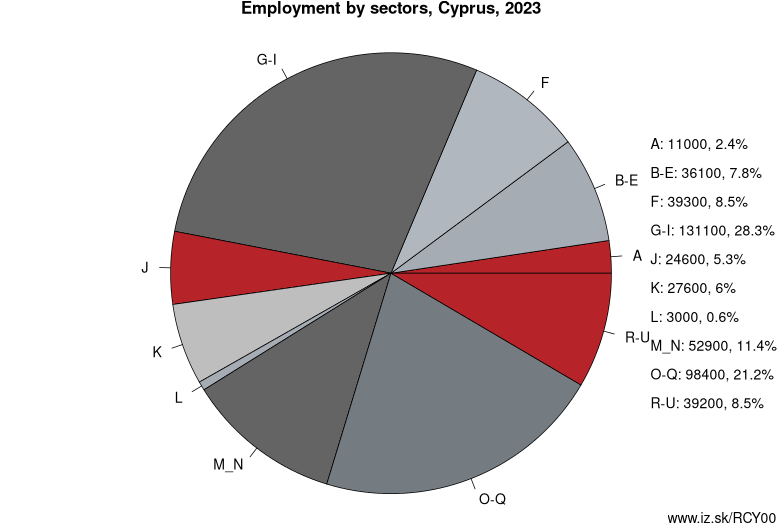
Employment by sectors, Cyprus
| NACE r2 | % | NACE r2 | % | ||
|---|---|---|---|---|---|
| A | 11 | 2 % | B-E | 36.1 | 8 % |
| F | 39.3 | 8 % | G-I | 131.1 | 28 % |
| J | 24.6 | 5 % | K | 27.6 | 6 % |
| L | 3 | 1 % | M_N | 52.9 | 11 % |
| O-Q | 98.4 | 21 % | R-U | 39.2 | 8 % |
| TOTAL | 463.2 | 100 % |
Data for the period year 2023. Source of the data is Eurostat, table [lfst_r_lfe2en2].
Cyprus ( (listen)), officially called the Republic of Cyprus, is an island nation in the eastern Mediterranean Sea. It is the third largest and third most populous island in the Mediterranean, and is located south of Turkey; west of Syria; northwest of Lebanon, Israel and Palestine; north of Egypt; and southeast of Greece. Nicosia is the country's capital and largest city.
The earliest known human activity on the island dates to around the 10th millennium BC. Archaeological remains from this period include the well-preserved Neolithic village of Khirokitia, and Cyprus is home to some of the oldest water wells in the world. Cyprus was settled by Mycenaean Greeks in two waves in the 2nd millennium BC. As a strategic location in the Eastern Mediterranean, it was subsequently occupied by several major powers, including the empires of the Assyrians, Egyptians and Persians, from whom the island was seized in 333 BC by Alexander the Great. Subsequent rule by Ptolemaic Egypt, the Classical and Eastern Roman Empire, Arab caliphates for a short period, the French Lusignan dynasty and the Venetians, was followed by over three centuries of Ottoman rule between 1571 and 1878 (de jure until 1914).
Cyprus was placed under the UK's administration based on the Cyprus Convention in 1878 and was formally annexed by the UK in 1914. The future of the island became a matter of disagreement between the two prominent ethnic communities, Greek Cypriots, who made up 77 % of the population in 1960, and Turkish Cypriots, who made up 18 % of the population. From the 19th century onwards, the Greek Cypriot population pursued enosis, union with Greece, which became a Greek national policy in the 1950s. The Turkish Cypriot population initially advocated the continuation of the British rule, then demanded the annexation of the island to Turkey, and in the 1950s, together with Turkey, established a policy of taksim, the partition of Cyprus and the creation of a Turkish polity in the north. Following nationalist violence in the 1950s, Cyprus was granted independence in 1960.
Subregions: Κύπρος
Suggested citation: Michal Páleník: Europe and its regions in numbers - Cyprus – CY00, IZ Bratislava, retrieved from: https://www.iz.sk/PCY00, ISBN: 978-80-970204-9-1, DOI:10.5281/zenodo.10200164
 Share
Share Facebook
 Twitter
 News
News