Hamburg – DE60
EU regions: Germany > Hamburg > Hamburg
| Indicator | Period | Value |
|---|---|---|
| Life long learning | ||
| life long learning participation | 2023 | 9.7 |
| Part time jobs and flexible employment | ||
| percentage of part time workers | 2022 | 25.4 |
| percentage of part time workers, men | 2022 | 13.15 |
| percentage of part time workers, women | 2022 | 38.89 |
| Gender differences | ||
| gender gap in employment rate | 2023 | 91.97 |
| gender gap in unemployment rate | 2023 | 81.82 |
| Graduates and young people | ||
| unemployment rate of youth with elementary education | 2009 | 16.2 |
| NEET | 2023 | 8.1 |
| Gross domestic product | ||
| GDP per capita in PPS of EU average | 2022 | 195 |
| Employment | ||
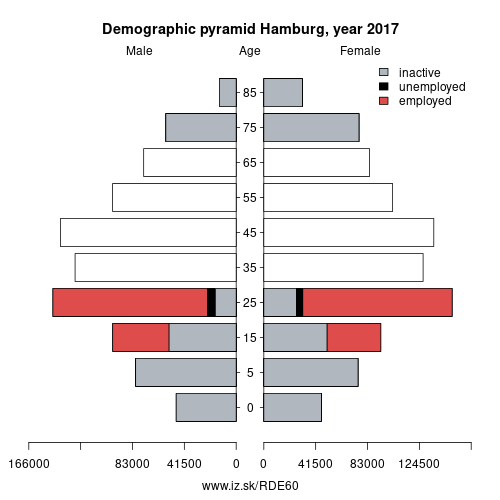
| employment rate | 2023 | 75.3 |
| Social exclusion | ||
| people at risk of poverty or social exclusion | 2019 | 23.7 |
More on wikipedia wikidata Q1055 on OpenStreetMap Hamburg slovensky: DE60
Subregions: Hamburg
Unemployment
| Indicator | Period | Value |
|---|---|---|
| Unemployment | ||
| unemployment rate | 2023 | 4.2 |
| youth unemployment rate | 2019 | 8.3 |
| Long term unemployment | ||
| long term unemployment | 2022 | 1.6 |
| share of long term unemployed | 2022 | 40.4 |
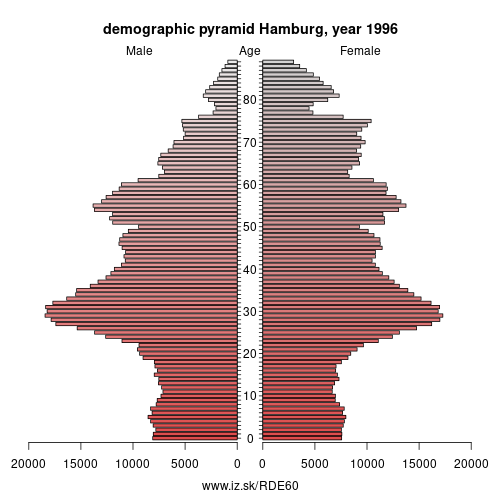
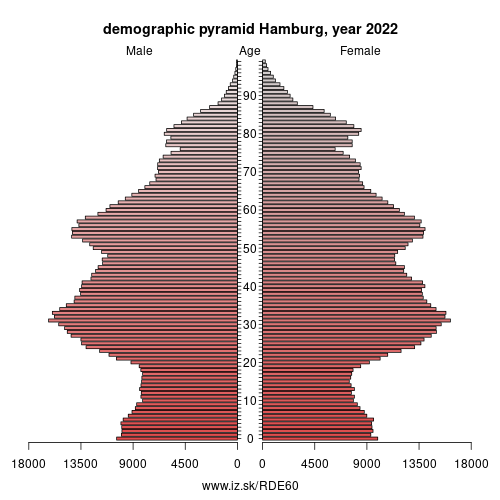
Demographics
| Indicator | Period | Value |
|---|---|---|
| Demographics | ||
| number of inhabitants | 2023 | 1.892122e+06 |
| population density | 2022 | 2638.1 |
| old-age dependency ratio | 2023 | 26.5 |
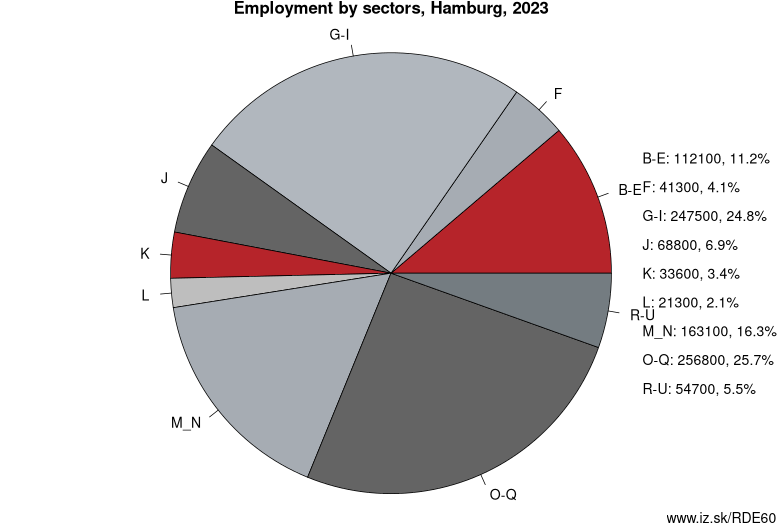
Employment by sectors, Hamburg
| NACE r2 | % | NACE r2 | % | ||
|---|---|---|---|---|---|
| B-E | 112.1 | 11 % | F | 41.3 | 4 % |
| G-I | 247.5 | 25 % | J | 68.8 | 7 % |
| K | 33.6 | 3 % | L | 21.3 | 2 % |
| M_N | 163.1 | 16 % | O-Q | 256.8 | 26 % |
| R-U | 54.7 | 5 % | TOTAL | 1000.9 | 100 % |
Data for the period year 2023. Source of the data is Eurostat, table [lfst_r_lfe2en2].
Neighbours: Lüneburg Government Region, Schleswig-Holstein
Subregions: Hamburg
Suggested citation: Michal Páleník: Europe and its regions in numbers - Hamburg – DE60, IZ Bratislava, retrieved from: https://www.iz.sk/PDE60, ISBN: 978-80-970204-9-1, DOI:10.5281/zenodo.10200164
https://www.iz.sk/en/projects/eu-regions/DE60
 Share
Share Facebook
 Twitter
 News
News