Finland – FI
More on wikipedia wikidata Q33 on OpenStreetMap Finland slovensky: FI
Subregions: Mainland Finland, Åland
Unemployment
| Indicator | Period | Value |
|---|---|---|
| Unemployment | ||
| unemployment rate | 2022 | 6.9 |
| youth unemployment rate | 2023q4 | 14.1 |
| unemployment rate of low educated people | 2023q4 | 16.5 |
| Long term unemployment | ||
| long term unemployment | 2022 | 1.5 |
| share of long term unemployed | 2022 | 22.8 |
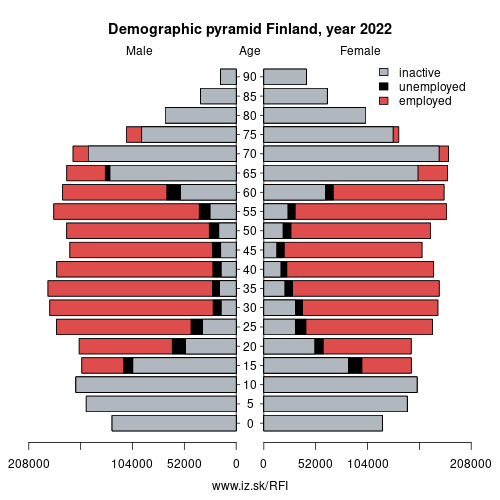
Composition of population according to age group, education and economic activity, Finland
| Age group | Low education | Middle education | High education |
|---|---|---|---|
| Y20-29 | P: 71.1 E: 30.6; U: 6.7; I: 33.8 | P: 431.9 E: 292.9; U: 32.1; I: 106.9 | P: 136.7 E: 118.6; U: 5.8; I: 12.3 |
| Y30-39 | P: 72.5 E: 42.4; U: 5.6; I: 24.5 | P: 321.2 E: 264.0; U: 15.6; I: 41.6 | P: 335.5 E: 304.3; U: 9.5; I: 21.7 |
| Y40-49 | P: 61.5 E: 37.1; U: 4.8; I: 19.6 | P: 293.6 E: 247.4; U: 15.7; I: 30.5 | P: 327.3 E: 300.1; U: 10.6; I: 16.6 |
| Y50-59 | P: 85.2 E: 56.0; U: 7.1; I: 22.1 | P: 321.1 E: 262.3; U: 18.2; I: 40.6 | P: 291.4 E: 262.3; U: 10.9; I: 18.2 |
| Y60-69 | P: 138.0 E: 37.9; U: 4.8; I: 95.3 | P: 324.6 E: 130.7; U: 10.5; I: 183.4 | P: 244.3 E: 114.9; U: 8.5; I: 120.9 |
Note: in thousands in 2022, according to labour force sample survey. P – total population, E – employed, U – unemployed, I – number of ecnomically inactive
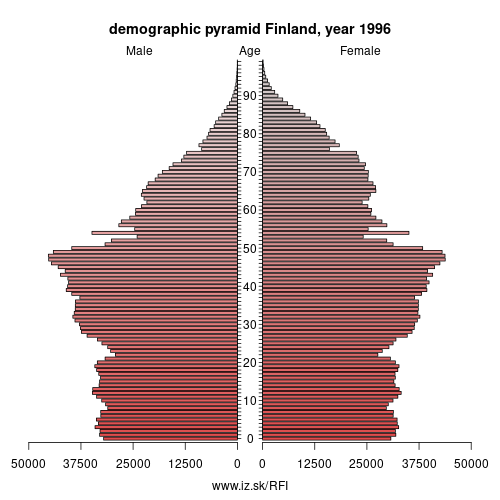
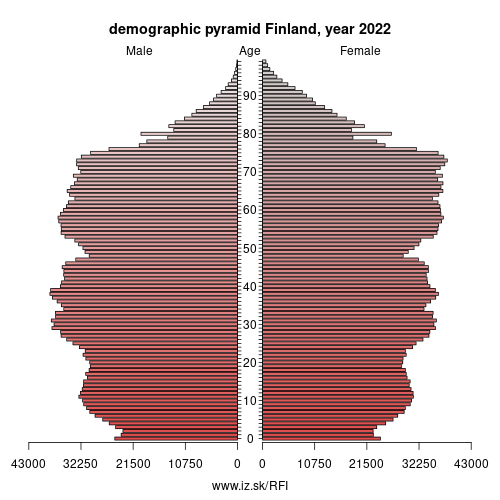
Demographics
| Indicator | Period | Value |
|---|---|---|
| Demographics | ||
| number of inhabitants | 2023 | 5.56397e+06 |
| population density | 2022 | 18.3 |
| old-age dependency ratio | 2023 | 37.8 |
| Population ageing | ||
| unemployment rate – over 55 years | 2023q4 | 6.8 |
| aggregate replacement ratio | 2023 | 0.52 |
| aggregate replacement ratio – females | 2023 | 0.51 |
| life expectancy of a 50 year old | 2021 | 33.5 |
| healty life expectancy at 50 years | 2021 | 20.1 |
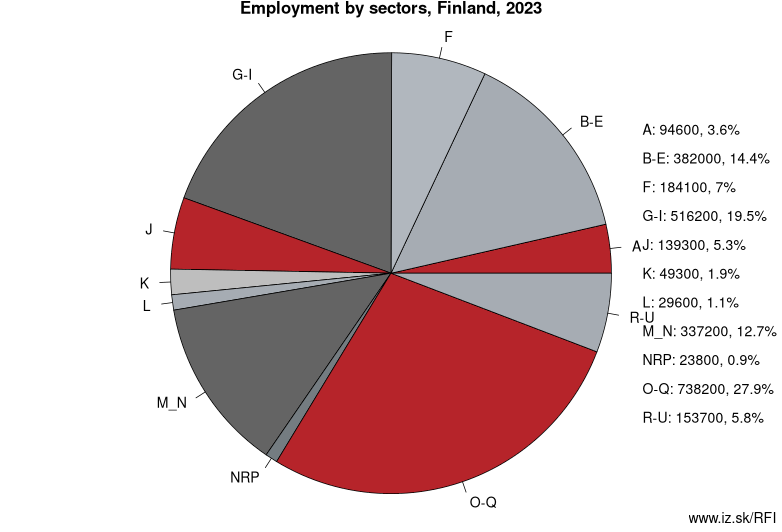
Employment by sectors, Finland
| NACE r2 | % | NACE r2 | % | ||
|---|---|---|---|---|---|
| A | 98.1 | 4 % | B-E | 372.9 | 14 % |
| F | 185 | 7 % | G-I | 526.9 | 20 % |
| J | 134.8 | 5 % | K | 47.5 | 2 % |
| L | 30 | 1 % | M_N | 334.3 | 13 % |
| NRP | 31.3 | 1 % | O-Q | 722.3 | 27 % |
| R-U | 157.1 | 6 % | TOTAL | 2640.2 | 100 % |
Data for the period year 2022. Source of the data is Eurostat, table [lfst_r_lfe2en2].
Finland (Finnish: Suomi [suo̯mi] (listen); Swedish: Finland [ˈfɪnland] (listen)), officially the Republic of Finland (Finnish: Suomen tasavalta, Swedish: Republiken Finland (listen to all)), is a Nordic country in Northern Europe bordering the Baltic Sea, Gulf of Bothnia, and Gulf of Finland, between Norway to the north, Sweden to the northwest, and Russia to the east. The capital and largest city is Helsinki. Other major cities are Espoo, Vantaa, Tampere, Oulu and Turku.
Finland's population is 5.52 million (as of half of 2019), the majority of whom live in the central and south of the country and speak Finnish, a Finnic language from the Uralic language family, unrelated to the Scandinavian languages. Finland is the eighth-largest country in Europe and the most sparsely populated country in the European Union. It is a parliamentary republic of 311 municipalities, and one autonomous region, the Åland Islands. Over 1.4 million people live in the Greater Helsinki metropolitan area, which produces one third of the country's GDP.
Finland was inhabited when the last ice age ended, approximately 9000 BCE. Comb Ceramic culture introduced pottery 5200 BCE and Corded Ware culture coincided with the start of agriculture between 3000 and 2500 BCE. The Bronze Age and Iron Age were characterised by extensive contacts with other cultures in the Fennoscandian and Baltic regions. At the time Finland had three main cultural areas – Southwest Finland, Tavastia and Karelia. From the late 13th century, Finland gradually became an integral part of Sweden through the Northern Crusades and the Swedish part-colonisation of coastal Finland, a legacy reflected in the prevalence of the Swedish language and its official status. In 1809, Finland was incorporated into the Russian Empire as the autonomous Grand Duchy of Finland.
Subregions: Mainland Finland, Åland
Suggested citation: Michal Páleník: Europe and its regions in numbers - Finland – FI, IZ Bratislava, retrieved from: https://www.iz.sk/PFI, ISBN: 978-80-970204-9-1, DOI:10.5281/zenodo.10200164
 Share
Share Facebook
 Twitter
 News
News