Opole Voivodeship – PL52
EU regions: Poland > MAKROREGION POŁUDNIOWO-ZACHODNI > Opole Voivodeship
| Indicator | Period | Value |
|---|---|---|
| Life long learning | ||
| life long learning participation | 2023 | 5.3 |
| Part time jobs and flexible employment | ||
| percentage of part time workers | 2022 | 7.46 |
| percentage of part time workers, men | 2019 | 3.25 |
| percentage of part time workers, women | 2022 | 11.43 |
| Gender differences | ||
| gender gap in employment rate | 2023 | 84.56 |
| gender gap in unemployment rate | 2019 | 124.14 |
| Graduates and young people | ||
| unemployment rate of youth with elementary education | 1999 | 46.5 |
| NEET | 2019 | 8.3 |
| Gross domestic product | ||
| GDP per capita in PPS of EU average | 2022 | 63 |
| Employment | ||
| employment rate | 2023 | 71.8 |
| Social exclusion | ||
| people at risk of poverty or social exclusion | 2020 | 16.3 |
More on wikipedia wikidata Q54171 on OpenStreetMap Opole Voivodeship slovensky: PL52
Unemployment
| Indicator | Period | Value |
|---|---|---|
| Unemployment | ||
| unemployment rate | 2023 | 2.8 |
| youth unemployment rate | 2015 | 16.6 |
| Long term unemployment | ||
| long term unemployment | 2015 | 2 |
| share of long term unemployed | 2015 | 30.7 |
| Unemployment according to labour offices | ||
| number of registered unemployed | February 2024 | 21 079 |
| number of unemployed women | February 2024 | 11 370 |
| number of long-term unemployed | February 2024 | 8186 |
Comparisson of unemployment according to ILO methodology and registered unemployment yeilds some differences.
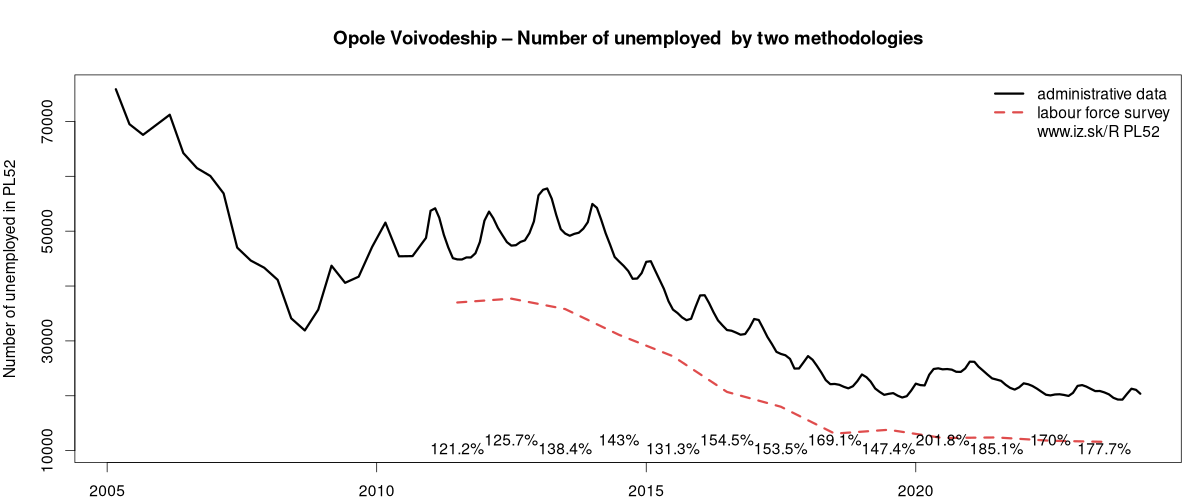
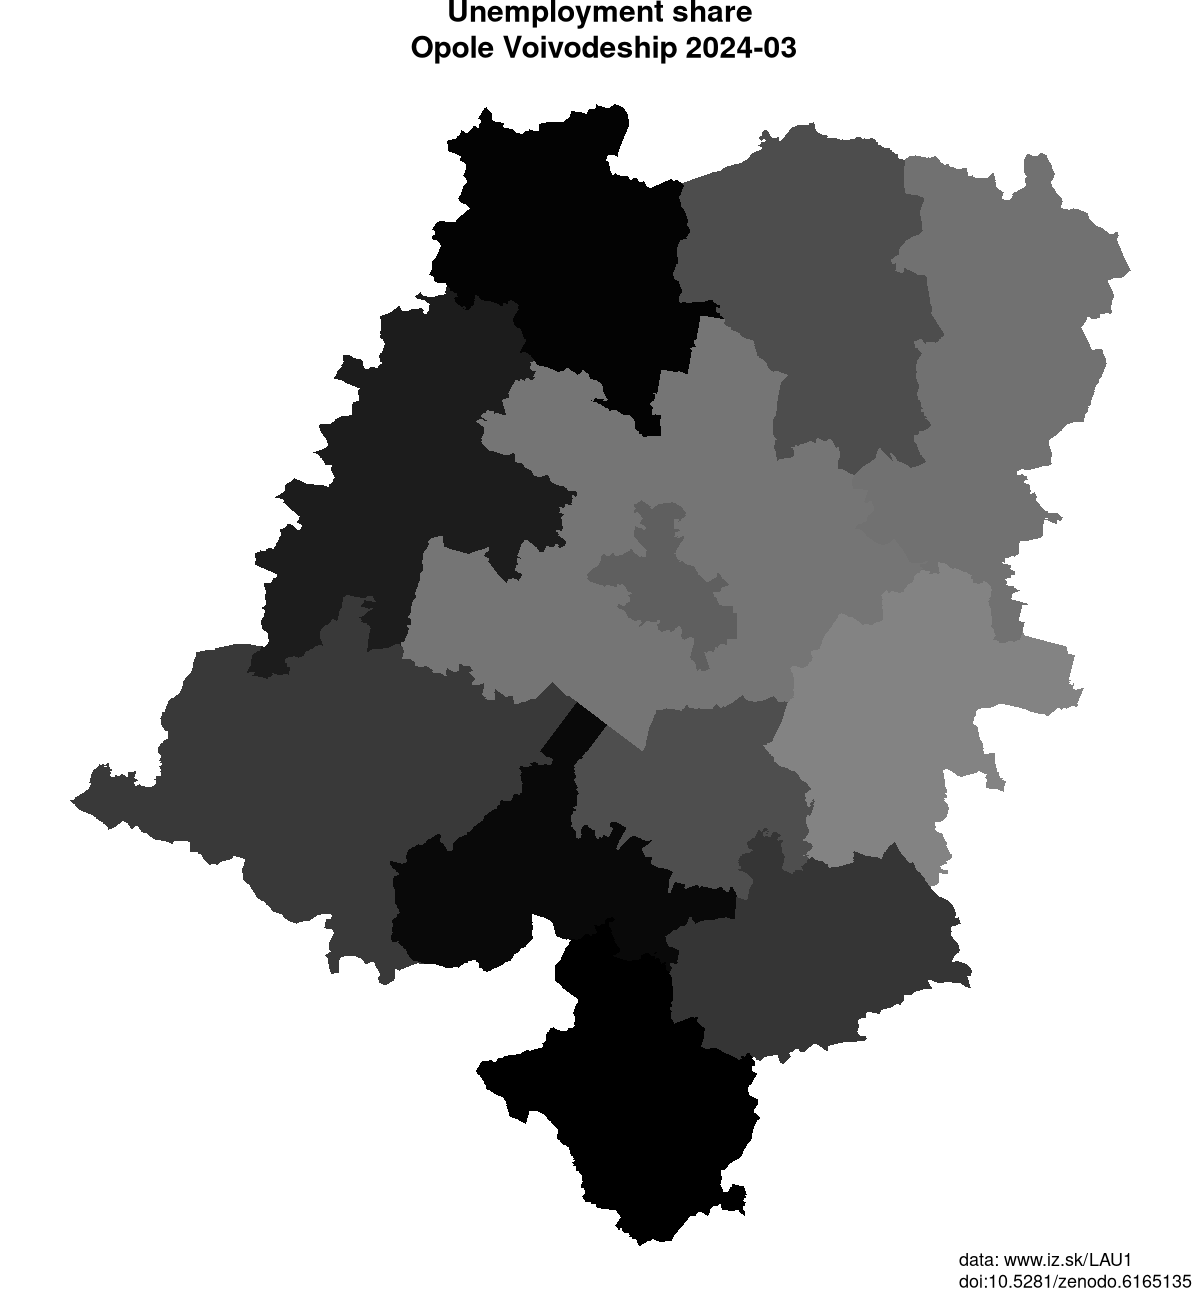
Data on unemployment in counties of Opole Voivodeship are available at Local Administrative Units data of Visegrad countries.
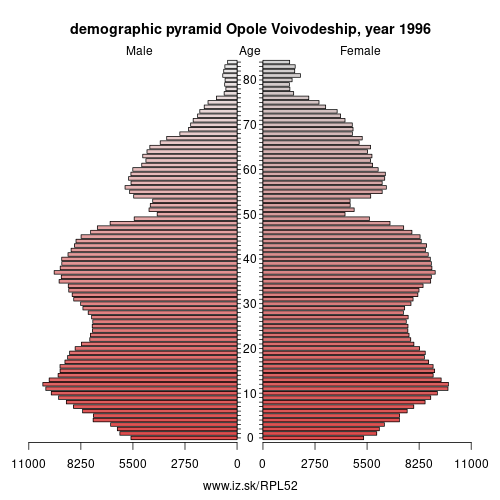
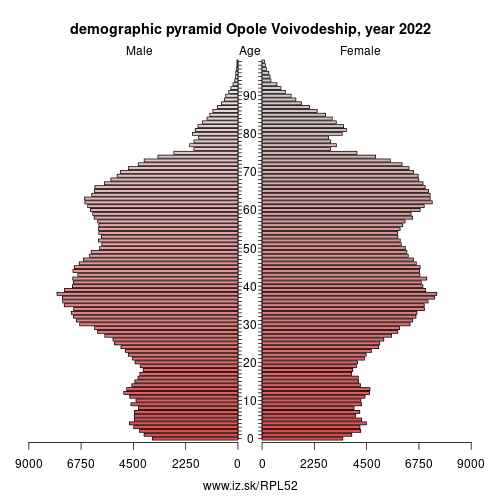
Demographics
| Indicator | Period | Value |
|---|---|---|
| Demographics | ||
| number of inhabitants | 2023 | 896 370 |
| population density | 2022 | 97.9 |
| old-age dependency ratio | 2023 | 32.4 |
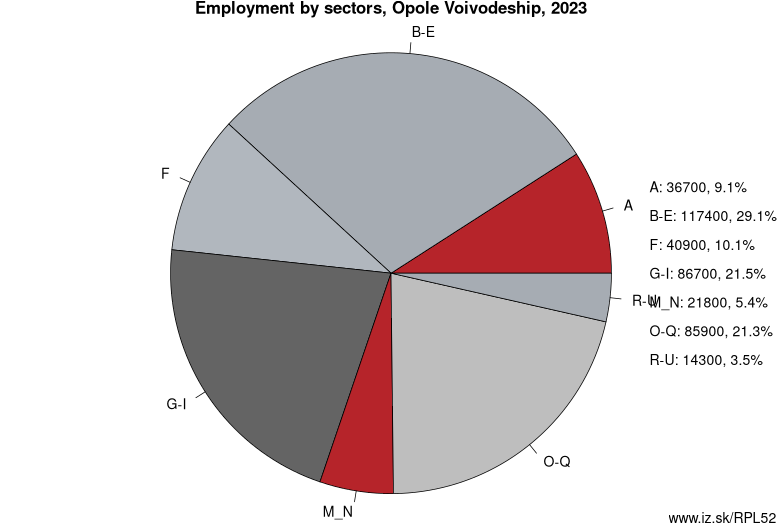
Employment by sectors, Opole Voivodeship
| NACE r2 | % | NACE r2 | % | ||
|---|---|---|---|---|---|
| A | 36.7 | 9 % | B-E | 117.4 | 28 % |
| F | 40.9 | 10 % | G-I | 86.7 | 21 % |
| M_N | 21.8 | 5 % | O-Q | 85.9 | 20 % |
| R-U | 14.3 | 3 % | TOTAL | 419.4 | 100 % |
Data for the period year 2023. Source of the data is Eurostat, table [lfst_r_lfe2en2].
Other: MAKROREGION POŁUDNIOWO-ZACHODNI, Opole Voivodeship, Lower Silesian Voivodeship
Neighbours: Central Moravia, Moravian-Silesian Region, Greater Poland Voivodeship, Lower Silesian Voivodeship, Łódź Voivodeship, Silesian Voivodeship
Suggested citation: Michal Páleník: Europe and its regions in numbers - Opole Voivodeship – PL52, IZ Bratislava, retrieved from: https://www.iz.sk/PPL52, ISBN: 978-80-970204-9-1, DOI:10.5281/zenodo.10200164
Local Administrative Units data of Visegrad countries
Statistical data on LAU1 regions of Slovakia, Czechia, Poland, Hungary. This LAU1 dataset on 733 regions contains data on population, age structure of inhabitants, on number and structure of unemployed and is regularly updated.. . .
 Share
Share Facebook
 Twitter
 News
News