Sud-Vest Oltenia – RO41
EU regions: Romania > Macroregiunea Patru > Sud-Vest Oltenia
| Indicator | Period | Value |
|---|---|---|
| Life long learning | ||
| life long learning participation | 2024 | 3.7 |
| Part time jobs and flexible employment | ||
| percentage of part time workers | 2024 | 2.28 |
| percentage of part time workers, men | 2024 | 2.21 |
| percentage of part time workers, women | 2024 | 2.37 |
| Gender differences | ||
| gender gap in employment rate | 2024 | 76.74 |
| gender gap in unemployment rate | 2024 | 78.82 |
| Graduates and young people | ||
| unemployment rate of youth with elementary education | 2003 | 6 |
| NEET | 2024 | 21.1 |
| Gross domestic product | ||
| GDP per capita in PPS of EU average | 2023 | 62 |
| Employment | ||
| employment rate | 2024 | 58.6 |
| Social exclusion | ||
| people at risk of poverty or social exclusion | 2020 | 38.7 |
More on wikipedia wikidata Q634271 on OpenStreetMap Sud-Vest Oltenia slovensky: RO41
Subregions: Dolj, Gorj, Mehedinţi, Olt County, Vâlcea
Unemployment
| Indicator | Period | Value |
|---|---|---|
| Unemployment | ||
| unemployment rate | 2024 | 7.8 |
| youth unemployment rate | 2024 | 30.6 |
| Long term unemployment | ||
| long term unemployment | 2024 | 2.6 |
| share of long term unemployed | 2024 | 33.4 |
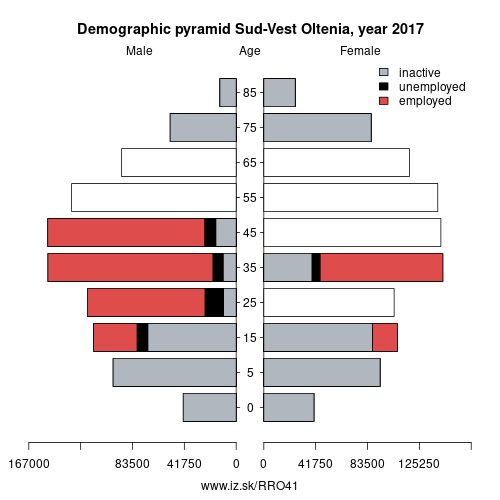
Demographics

| Indicator | Period | Value |
|---|---|---|
| Demographics | ||
| number of inhabitants | 2024 | 1 855 697 |
| population density | 2023 | 64.8 |
| old-age dependency ratio | 2024 | 33.6 |
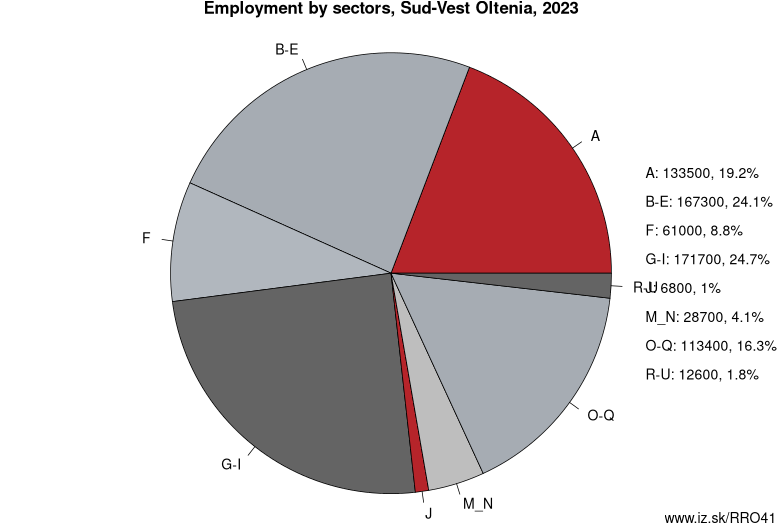
Employment by sectors, Sud-Vest Oltenia
| NACE r2 | % | NACE r2 | % | ||
|---|---|---|---|---|---|
| A | 136.9 | 19% | B-E | 167.1 | 24% |
| F | 55.6 | 8% | G-I | 180.2 | 25% |
| J | 10.5 | 1% | M_N | 25.1 | 4% |
| O-Q | 111.8 | 16% | R-U | 14.2 | 2% |
| TOTAL | 707.1 | 100% |
Data for the period year 2024. Source of the data is Eurostat, table [lfst_r_lfe2en2].
Other: Macroregiunea Patru, Sud-Vest Oltenia, Vest
Neighbours: Регион Јужне и Источне Србије, Centru, Severozapaden Planning Region, Sud-Muntenia, Vest
Subregions: Dolj, Gorj, Mehedinţi, Olt County, Vâlcea
Suggested citation: Michal Páleník: Europe and its regions in numbers - Sud-Vest Oltenia – RO41, IZ Bratislava, retrieved from: https://www.iz.sk/PRO41, ISBN: 978-80-970204-9-1, DOI:10.5281/zenodo.10200164
https://www.iz.sk/en/projects/eu-regions/RO41
 Share
Share Facebook
 Twitter
 News
News