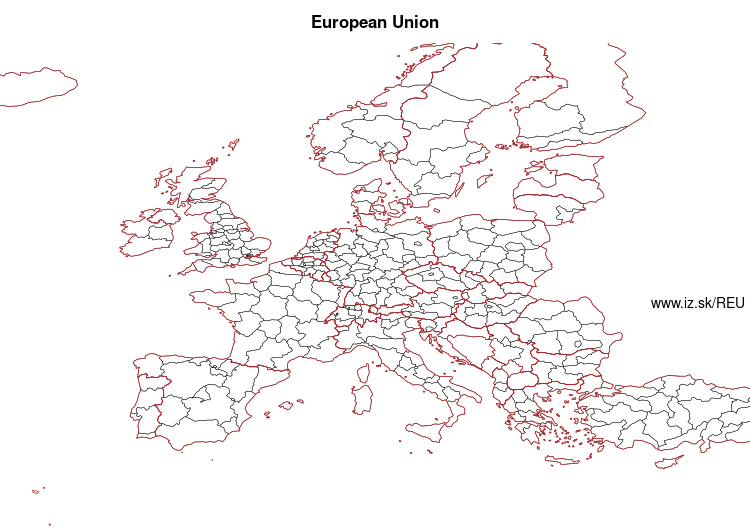
Regions of the European Union
Basic data about NUTS region of the Europe, European Union, candidate countries and potential candidate countries.
Suggested citation: Michal Páleník: Europe and its regions in numbers - Regions of the European Union, IZ Bratislava, retrieved from: https://www.iz.sk/E5v, ISBN: 978-80-970204-9-1, DOI:10.5281/zenodo.10200164
- AT – Austria
- BE – Belgium
- BG – Bulgaria
- CY – Cyprus
- CZ – Czech Republic
- DE – Germany
- DK – Denmark
- EE – Estonia
- EL – Greece
- ES – Spain
- FI – Finland
- FR – France
- FRB – Centre-Val de Loire
- FRC – Bourgogne-Franche-Comté
- FRD – Normandy
- FRE – Hauts-de-France
- FRF – Grand Est
- FRG – Pays de la Loire
- FRH – Brittany
- FRI – Nouvelle-Aquitaine
- FRJ – Occitania
- FRK – Auvergne-Rhône-Alpes
- FRL – Provence-Alpes-Côte d'Azur
- FRM – Corsica
- FRY – overseas department and region of France
- FR1 – Île-de-France
- HR – Croatia
- HU – Hungary
- IE – Ireland
- IT – Italy
- LT – Lithuania
- LU – Luxembourg
- LV – Latvia
- MT – Malta
- NL – Netherlands
- PL – Poland
- PT – Portugal
- RO – Romania
- SE – Sweden
- SI – Slovenia
- SK – Slovakia
Európske združenie voľného obchodu
Ostatné regióny
- AL – Albania
- EU – European Union
- ME – Montenegro
- MK – North Macedonia
- RS – Serbia
- TR – Turkey
- TRA – Northeast Anatolia Region (statistical)
- TRB – Central East Anatolia Region (statistical)
- TRC – Southeast Anatolia Region (statistical)
- TR1 – Istanbul Province
- TR2 – West Marmara Region
- TR3 – Aegean Region (statistical)
- TR4 – East Marmara Region (statistical)
- TR5 – West Anatolia Region (statistical)
- TR6 – Mediterranean Region (statistical)
- TR7 – Central Anatolia Region (statistical)
- TR8 – West Black Sea Region (statistical)
- TR9 – East Black Sea Region (statistical)
- UK – United Kingdom
https://www.iz.sk/en/projects/eu-regions
 Share
Share Facebook
 Twitter
 News
News