Kent – UKJ4
EU regions: United Kingdom > South East England > Kent
| Indicator | Period | Value |
|---|---|---|
| Life long learning | ||
| life long learning participation | 2019 | 14.6 |
| Part time jobs and flexible employment | ||
| percentage of part time workers | 2019 | 25.51 |
| percentage of part time workers, men | 2019 | 10.55 |
| percentage of part time workers, women | 2019 | 41.36 |
| Gender differences | ||
| gender gap in employment rate | 2019 | 92.39 |
| gender gap in unemployment rate | 2019 | 79.07 |
| Graduates and young people | ||
| unemployment rate of youth with elementary education | 2016 | 29.9 |
| NEET | 2019 | 8.7 |
| Employment | ||
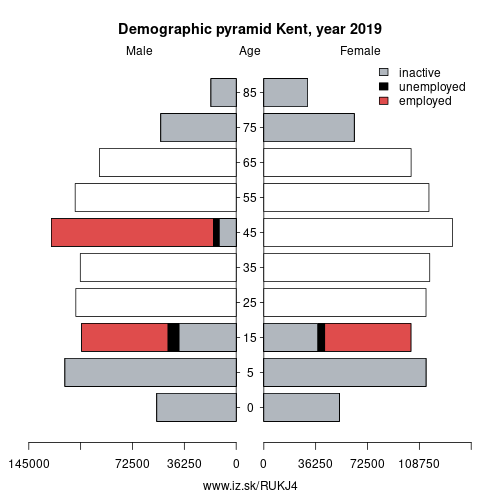
| employment rate | 2019 | 77.1 |
More on wikipedia wikidata Q23298 on OpenStreetMap Kent slovensky: UKJ4
Subregions: Medway, Kent Thames Gateway, East Kent, Mid Kent, West Kent
Unemployment
| Indicator | Period | Value |
|---|---|---|
| Unemployment | ||
| unemployment rate | 2019 | 4 |
| youth unemployment rate | 2019 | 10.7 |
| Long term unemployment | ||
| long term unemployment | 2019 | 0.8 |
| share of long term unemployed | 2019 | 21.1 |
Demographics
| Indicator | Period | Value |
|---|---|---|
| Demographics | ||
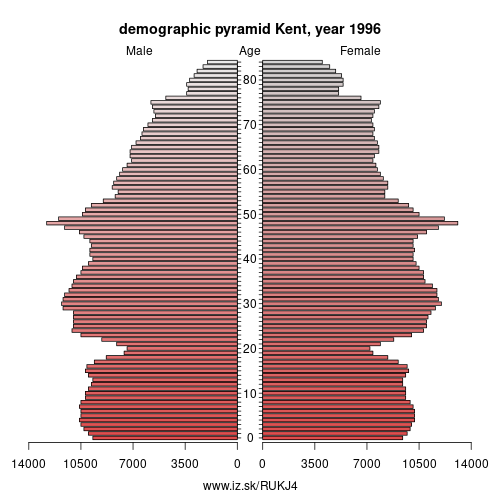
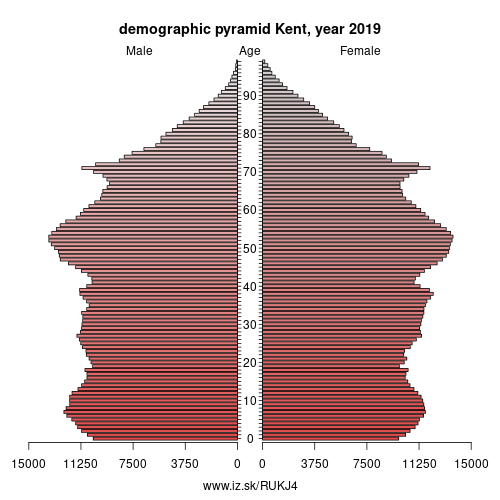
| number of inhabitants | 2019 | 1.854717e+06 |
| population density | 2018 | 494.2 |
| old-age dependency ratio | 2019 | 31.5 |
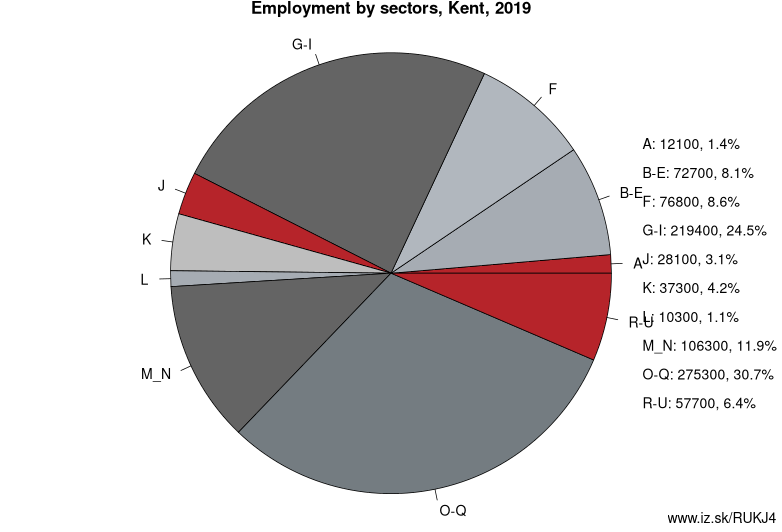
Employment by sectors, Kent
| NACE r2 | % | NACE r2 | % | ||
|---|---|---|---|---|---|
| A | 12.1 | 1 % | B-E | 72.7 | 8 % |
| F | 76.8 | 9 % | G-I | 219.4 | 24 % |
| J | 28.1 | 3 % | K | 37.3 | 4 % |
| L | 10.3 | 1 % | M_N | 106.3 | 12 % |
| O-Q | 275.3 | 31 % | R-U | 57.7 | 6 % |
| TOTAL | 899.3 | 100 % |
Data for the period year 2019. Source of the data is Eurostat, table [lfst_r_lfe2en2].
Kent is a county in South East England and one of the home counties. It borders Greater London to the north-west, Surrey to the west and East Sussex to the south-west. The county also shares borders with Essex along the estuary of the River Thames (connected by land via High Speed 1 and the Dartford Crossing), and with the French department of Pas-de-Calais through the Channel Tunnel. The county town is Maidstone.
Canterbury Cathedral in Kent has been the seat of the Archbishop of Canterbury, leader of the Church of England, since the Reformation. Prior to that it was built by Catholics, dating back to the conversion of England to Catholicism by Saint Augustine that began in the 6th century. Before the English Reformation the cathedral was part of a Benedictine monastic community known as Christ Church, Canterbury, as well as being the seat of the Catholic Archbishop of Canterbury. The last Catholic Archbishop of Canterbury was Reginald Pole. Rochester Cathedral is also in Kent, in Medway. It is the second-oldest cathedral in England, with Canterbury Cathedral being the oldest.
Other: South East England, Hampshire and Isle of Wight, Surrey, East and West Sussex, Kent, Berkshire, Buckinghamshire and Oxfordshire
Neighbours: Outer London – South, Outer London – East and North East, Surrey, East and West Sussex
Subregions: Medway, Kent Thames Gateway, East Kent, Mid Kent, West Kent
Suggested citation: Michal Páleník: Europe and its regions in numbers - Kent – UKJ4, IZ Bratislava, retrieved from: https://www.iz.sk/PUKJ4, ISBN: 978-80-970204-9-1, DOI:10.5281/zenodo.10200164
 Share
Share Facebook
 Twitter
 News
News