Estonia – EE00
EU regions: Estonia > Estonia > Estonia
| Indicator | Period | Value |
|---|---|---|
| Life long learning | ||
| life long learning participation | 2023 | 23.2 |
| Part time jobs and flexible employment | ||
| percentage of part time workers | 2022 | 13.98 |
| percentage of part time workers, men | 2022 | 9.04 |
| percentage of part time workers, women | 2022 | 19.08 |
| Gender differences | ||
| gender gap in employment rate | 2023 | 97.8 |
| gender gap in unemployment rate | 2023 | 108.2 |
| Graduates and young people | ||
| unemployment rate of youth with elementary education | 2023 | 28.1 |
| NEET | 2023 | 9.6 |
| Gross domestic product | ||
| GDP per capita in PPS of EU average | 2022 | 85 |
| Employment | ||
| employment rate | 2023 | 76.2 |
More on wikipedia wikidata Q191 on OpenStreetMap Estonia slovensky: EE00
Subregions: Põhja-Eesti, Lääne-Eesti, Kesk-Eesti, Kirde-Eesti, Lõuna-Eesti
Unemployment
| Indicator | Period | Value |
|---|---|---|
| Unemployment | ||
| unemployment rate | 2023 | 6.6 |
| youth unemployment rate | 2023 | 17.3 |
| Long term unemployment | ||
| long term unemployment | 2023 | 1.3 |
| share of long term unemployed | 2023 | 20.8 |
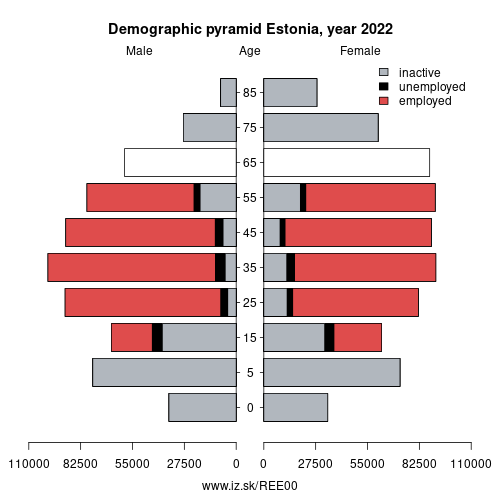
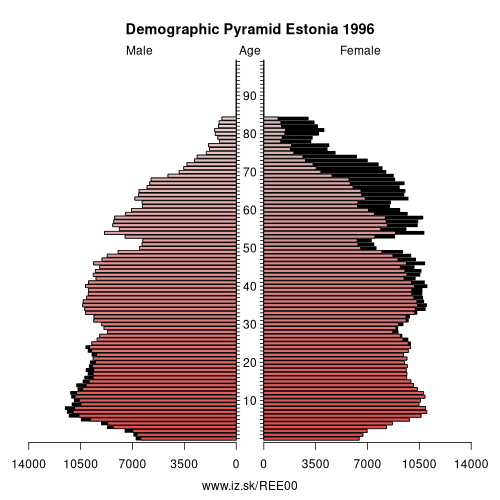
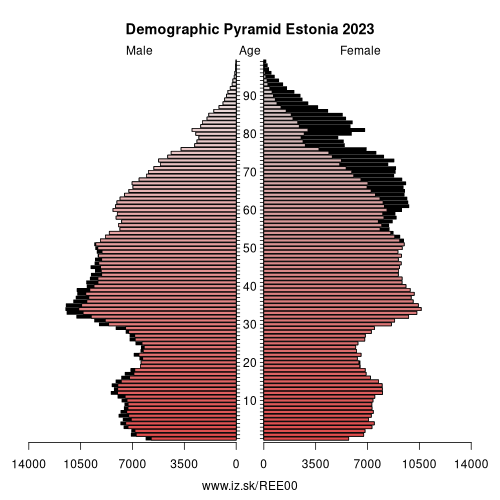
Demographics
| Indicator | Period | Value |
|---|---|---|
| Demographics | ||
| number of inhabitants | 2023 | 1.365884e+06 |
| population density | 2022 | 31 |
| old-age dependency ratio | 2023 | 31.9 |
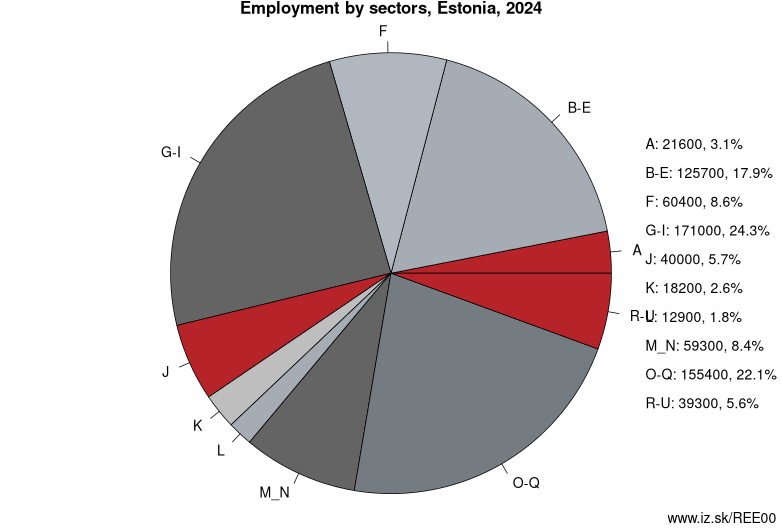
Employment by sectors, Estonia
| NACE r2 | % | NACE r2 | % | ||
|---|---|---|---|---|---|
| A | 18.2 | 3 % | B-E | 133.5 | 19 % |
| F | 58.1 | 8 % | G-I | 164.2 | 23 % |
| J | 36.7 | 5 % | K | 17.7 | 3 % |
| L | 13.6 | 2 % | M_N | 58.8 | 8 % |
| O-Q | 159.2 | 23 % | R-U | 40.1 | 6 % |
| TOTAL | 700 | 100 % |
Data for the period year 2023. Source of the data is Eurostat, table [lfst_r_lfe2en2].
From Wikipedia: Estonia (Estonian: Eesti [ˈeːsʲti] (listen)), officially the Republic of Estonia (Estonian: Eesti Vabariik), is a country in Northern Europe. It is bordered to the north by the Gulf of Finland across from Finland, to the west by the Baltic Sea across from Sweden, to the south by Latvia, and to the east by Lake Peipus and Russia. The territory of Estonia consists of the mainland and of 2,222 islands on the eastern coast of the Baltic Sea, covering a total area of 45,227 km2 (17,462 sq mi), and is influenced by a humid continental climate. Tallinn, the capital of Estonia, and Tartu are the largest cities and urban areas in the country. Other notable cities include Narva, Pärnu, Kohtla-Järve and Viljandi. The official language of the country, Estonian, is the second-most-spoken Finnic language.
The territory of Estonia has been inhabited since at least 9,000 BC. Ancient Estonians became some of the last European pagans to adopt Christianity following the Livonian Crusade in the 13th century. After centuries of successive rule by Germans, Danes, Swedes, Poles and Russians, a distinct Estonian national identity began to emerge in the 19th and early 20th centuries. This culminated in independence from Russia in 1920 after a brief War of Independence at the end of World War I, where Estonians, led by General Laidoner, had to fight for their newborn freedom. Initially democratic prior to the Great Depression, Estonia experienced authoritarian rule from 1934 during the Era of Silence.
Neighbours: Latvia
Subregions: Põhja-Eesti, Lääne-Eesti, Kesk-Eesti, Kirde-Eesti, Lõuna-Eesti
Suggested citation: Michal Páleník: Europe and its regions in numbers - Estonia – EE00, IZ Bratislava, retrieved from: https://www.iz.sk/PEE00, ISBN: 978-80-970204-9-1, DOI:10.5281/zenodo.10200164
 Share
Share Facebook
 Twitter
 News
News