Basilicata – ITF5
EU regions: Italy > South Italy > Basilicata
| Indicator | Period | Value |
|---|---|---|
| Life long learning | ||
| life long learning participation | 2023 | 10.3 |
| Part time jobs and flexible employment | ||
| percentage of part time workers | 2022 | 15.34 |
| percentage of part time workers, men | 2022 | 7.92 |
| percentage of part time workers, women | 2022 | 27.57 |
| Gender differences | ||
| gender gap in employment rate | 2023 | 62.95 |
| gender gap in unemployment rate | 2023 | 159.02 |
| Graduates and young people | ||
| unemployment rate of youth with elementary education | 2014 | 47.8 |
| NEET | 2023 | 13.2 |
| Gross domestic product | ||
| GDP per capita in PPS of EU average | 2022 | 83 |
| Employment | ||
| employment rate | 2023 | 54.9 |
| Social exclusion | ||
| people at risk of poverty or social exclusion | 2020 | 43.8 |
More on wikipedia wikidata Q1452 on OpenStreetMap Basilicata slovensky: ITF5
Subregions: province of Potenza, province of Matera
Unemployment
| Indicator | Period | Value |
|---|---|---|
| Unemployment | ||
| unemployment rate | 2023 | 7.7 |
| youth unemployment rate | 2023 | 25.1 |
| Long term unemployment | ||
| long term unemployment | 2023 | 3.9 |
| share of long term unemployed | 2023 | 51.9 |
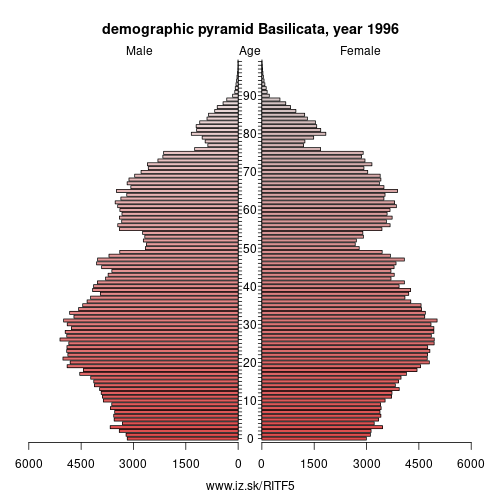
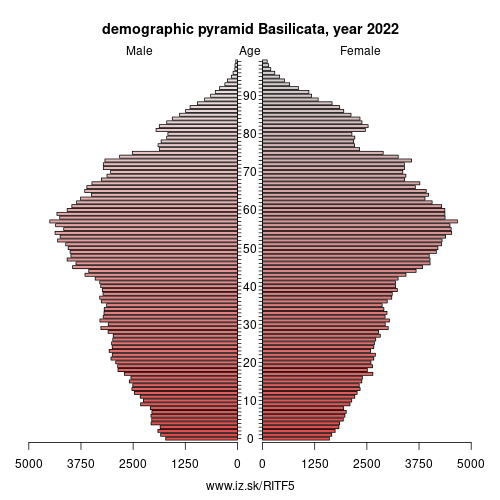
Demographics
| Indicator | Period | Value |
|---|---|---|
| Demographics | ||
| number of inhabitants | 2023 | 537 577 |
| population density | 2022 | 53.8 |
| old-age dependency ratio | 2023 | 39 |
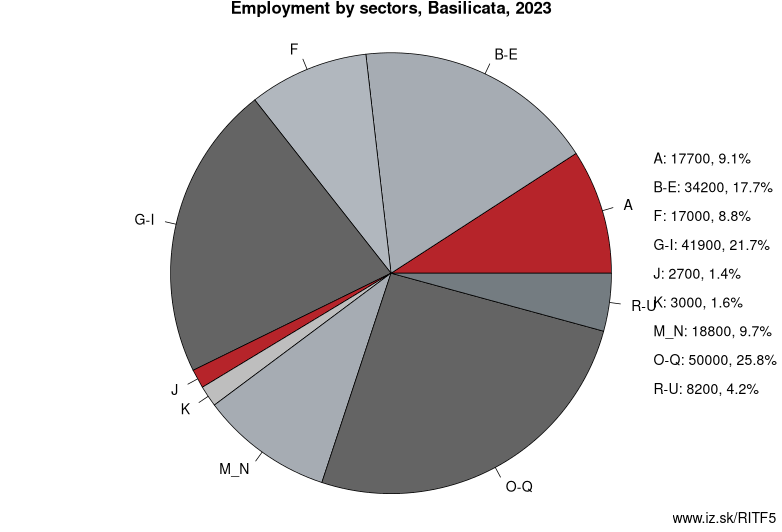
Employment by sectors, Basilicata
| NACE r2 | % | NACE r2 | % | ||
|---|---|---|---|---|---|
| A | 17.7 | 9 % | B-E | 34.2 | 18 % |
| F | 17 | 9 % | G-I | 41.9 | 22 % |
| J | 2.7 | 1 % | K | 3 | 2 % |
| M_N | 18.8 | 10 % | O-Q | 50 | 26 % |
| R-U | 8.2 | 4 % | TOTAL | 194.2 | 100 % |
Data for the period year 2023. Source of the data is Eurostat, table [lfst_r_lfe2en2].
From Wikipedia: Basilicata (UK: , US: , Italian: [baziliˈkaːta]), also known by its ancient name Lucania (, also US: , Italian: [luˈkaːnja]), is a region in Southern Italy, bordering on Campania to the west, Apulia (Puglia) to the north and east, and Calabria to the south. It also has two coastlines: a 30-km stretch on the Tyrrhenian Sea between Campania and Calabria, and a longer coastline along the Gulf of Taranto between Calabria and Apulia. The region can be thought of as the „instep" of Italy, with Calabria functioning as the „toe" and Apulia the „heel“. The region covers about 10,000 km2 (3,900 sq mi) and in 2010 had a population slightly under 600,000. The regional capital is Potenza. The region is divided into two provinces: Potenza and Matera.
Basilicata is an emerging tourist destination, thanks in particular to the city of Matera, whose historical quarter I Sassi became a UNESCO World Heritage Site in 1993, and has been designated European Capital of Culture 2019. The New York Times ranked Basilicata third in its list of "52 Places to Go in 2018", defining it "Italy’s best-kept secret".
Etymology
The name probably derives from "basilikos" (Greek: βασιλικός), which refers to the basileus, the Byzantine emperor, who ruled the region for 200 years, from 536/552 to 571/590 and from 879 to 1059. Others argue that the name may refer to the Basilica of Acerenza which held judicial power in the Middle Ages.
During the Greek and Roman Ages, Basilicata was known as Lucania, which possibly derives from "leukos" (Greek: λευκός), meaning „white“, from "lykos" (Greek: λύκος), meaning „wolf“, or from Latin word "lucus", meaning „sacred wood".
Geography
Basilicata covers an extensive part of the southern Apennine Mountains, between the Ofanto river in the north and the Pollino massif in the south.
Other: South Italy, Basilicata, Calabria, Molise, Apulia, Campania, Abruzzo
Neighbours: Apulia, Campania, Calabria
Subregions: province of Potenza, province of Matera
Suggested citation: Michal Páleník: Europe and its regions in numbers - Basilicata – ITF5, IZ Bratislava, retrieved from: https://www.iz.sk/PITF5, ISBN: 978-80-970204-9-1, DOI:10.5281/zenodo.10200164
 Share
Share Facebook
 Twitter
 News
News