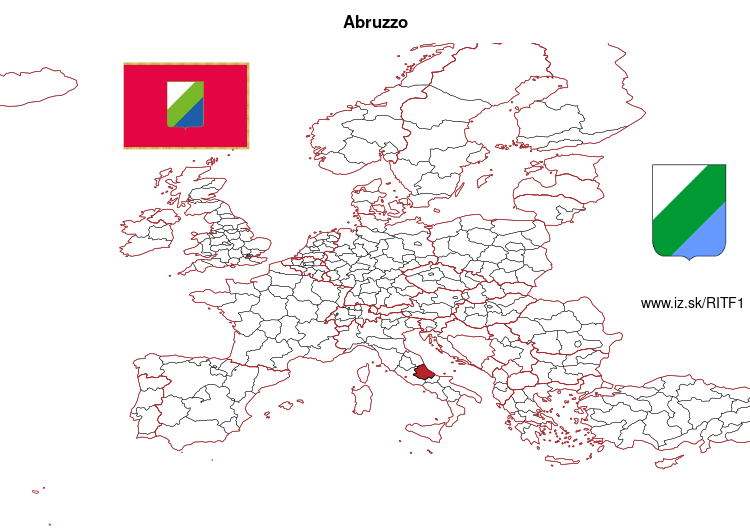
Abruzzo – ITF1
EU regions: Italy > South Italy > Abruzzo
| Indicator | Period | Value |
|---|---|---|
| Life long learning | ||
| life long learning participation | 2023 | 9.9 |
| Part time jobs and flexible employment | ||
| percentage of part time workers | 2022 | 17.79 |
| percentage of part time workers, men | 2022 | 7.99 |
| percentage of part time workers, women | 2022 | 31.91 |
| Gender differences | ||
| gender gap in employment rate | 2023 | 73.65 |
| gender gap in unemployment rate | 2023 | 116 |
| Graduates and young people | ||
| unemployment rate of youth with elementary education | 2021 | 33.1 |
| NEET | 2023 | 9.7 |
| Gross domestic product | ||
| GDP per capita in PPS of EU average | 2022 | 80 |
| Employment | ||
| employment rate | 2023 | 61.3 |
| Social exclusion | ||
| people at risk of poverty or social exclusion | 2020 | 27.9 |
More on wikipedia wikidata Q1284 on OpenStreetMap Abruzzo slovensky: ITF1
Subregions: Province of L'Aquila, Province of Teramo, Province of Pescara, Province of Chieti
Unemployment
| Indicator | Period | Value |
|---|---|---|
| Unemployment | ||
| unemployment rate | 2023 | 8.3 |
| youth unemployment rate | 2023 | 20.6 |
| Long term unemployment | ||
| long term unemployment | 2023 | 5 |
| share of long term unemployed | 2023 | 62 |
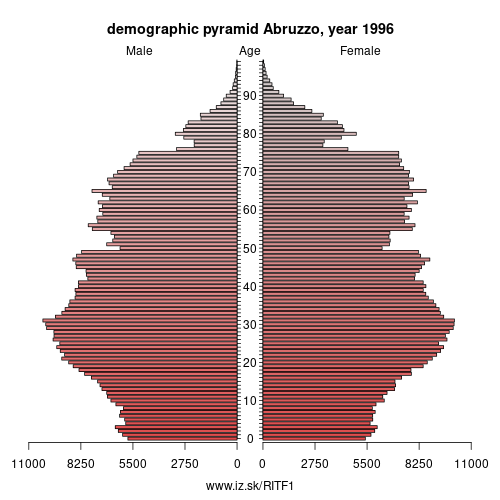
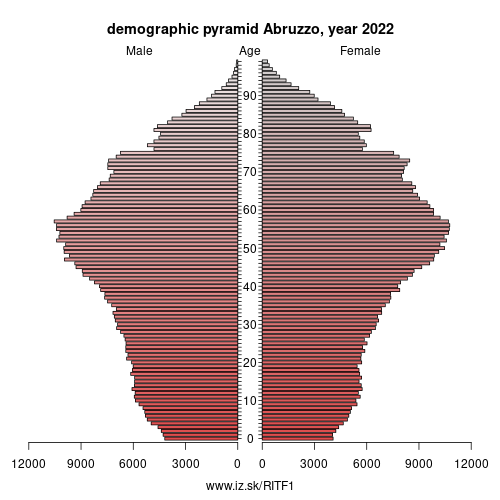
Demographics
| Indicator | Period | Value |
|---|---|---|
| Demographics | ||
| number of inhabitants | 2023 | 1.272627e+06 |
| population density | 2022 | 117.9 |
| old-age dependency ratio | 2023 | 40.2 |
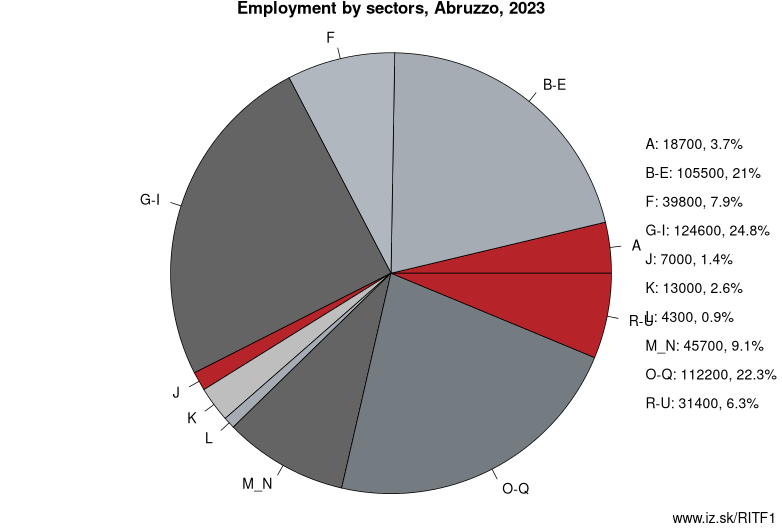
Employment by sectors, Abruzzo
| NACE r2 | % | NACE r2 | % | ||
|---|---|---|---|---|---|
| A | 18.7 | 4 % | B-E | 105.5 | 21 % |
| F | 39.8 | 8 % | G-I | 124.6 | 25 % |
| J | 7 | 1 % | K | 13 | 3 % |
| L | 4.3 | 1 % | M_N | 45.7 | 9 % |
| O-Q | 112.2 | 22 % | R-U | 31.4 | 6 % |
| TOTAL | 502.1 | 100 % |
Data for the period year 2023. Source of the data is Eurostat, table [lfst_r_lfe2en2].
From Wikipedia: Abruzzo (UK: , US: , Italian: [aˈbruttso]; Aquilano: Abbrùzzu) or Abruzzi is a region of Southern Italy with an area of 10,763 square km (4,156 sq mi) and a population of 1.2 million. It is divided into four provinces: L'Aquila, Teramo, Pescara, and Chieti. Its western border lies 80 km (50 mi) east of Rome. Abruzzo borders the region of Marche to the north, Lazio to the west and south-west, Molise to the south-east, and the Adriatic Sea to the east. Geographically, Abruzzo is divided into a mountainous area in the west, which includes the Gran Sasso d'Italia, and a coastal area in the east with beaches on the Adriatic Sea.
Abruzzo is considered a region of Southern Italy in terms of its culture, language, history and economy, although geographically it may also be considered central. The Italian Statistical Authority (ISTAT) also deems it to be part of Southern Italy, partly because of Abruzzo's historic association with the Kingdom of the Two Sicilies.
Abruzzo is known as „the greenest region in Europe" as almost half of its territory, the largest in Europe, is set aside as national parks and protected nature reserves. There are three national parks, one regional park, and 38 protected nature reserves. These ensure the survival of 75 % of Europe's living species, including rare species such as the small wading dotterel, the golden eagle, the Abruzzo (or Abruzzese) chamois, the Apennine wolf and the Marsican brown bear. Abruzzo is also home to Calderone, Europe's southernmost glacier.
The visiting nineteenth-century Italian diplomat and journalist Primo Levi (1853–1917) said that the adjectives „forte e gentile" (strong and gentle) best describe the beauty of the region and the character of its people.
Other: South Italy, Basilicata, Calabria, Molise, Apulia, Campania, Abruzzo
Neighbours: Molise, Lazio, Marche
Subregions: Province of L'Aquila, Province of Teramo, Province of Pescara, Province of Chieti
Suggested citation: Michal Páleník: Europe and its regions in numbers - Abruzzo – ITF1, IZ Bratislava, retrieved from: https://www.iz.sk/PITF1, ISBN: 978-80-970204-9-1, DOI:10.5281/zenodo.10200164
 Share
Share Facebook
 Twitter
 News
News