Overijssel – NL21
EU regions: Netherlands > Eastern Netherlands > Overijssel
| Indicator | Period | Value |
|---|---|---|
| Life long learning | ||
| life long learning participation | 2023 | 23.7 |
| Part time jobs and flexible employment | ||
| percentage of part time workers | 2022 | 39.88 |
| percentage of part time workers, men | 2022 | 16.75 |
| percentage of part time workers, women | 2022 | 66.82 |
| Gender differences | ||
| gender gap in employment rate | 2023 | 91.77 |
| gender gap in unemployment rate | 2023 | 103.45 |
| Graduates and young people | ||
| unemployment rate of youth with elementary education | 2023 | 6.8 |
| NEET | 2023 | 2.5 |
| Gross domestic product | ||
| GDP per capita in PPS of EU average | 2022 | 109 |
| Employment | ||
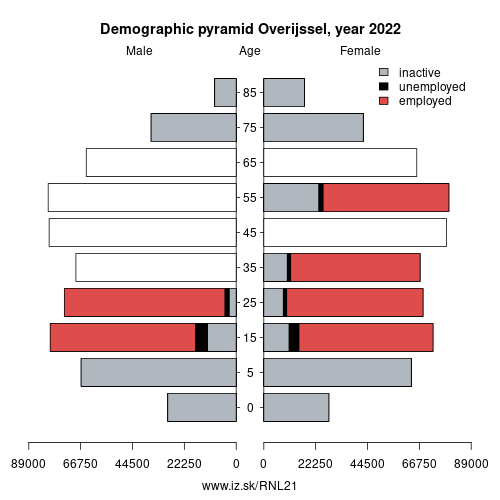
| employment rate | 2023 | 83.9 |
| Social exclusion | ||
| people at risk of poverty or social exclusion | 2020 | 14.9 |
More on wikipedia wikidata Q773 on OpenStreetMap Overijssel slovensky: NL21
Subregions: Noord-Overijssel, Zuidwest-Overijssel, Twente
Unemployment
| Indicator | Period | Value |
|---|---|---|
| Unemployment | ||
| unemployment rate | 2023 | 2.9 |
| youth unemployment rate | 2023 | 5.8 |
| Long term unemployment | ||
| long term unemployment | 2023 | 0.5 |
| share of long term unemployed | 2023 | 17.1 |
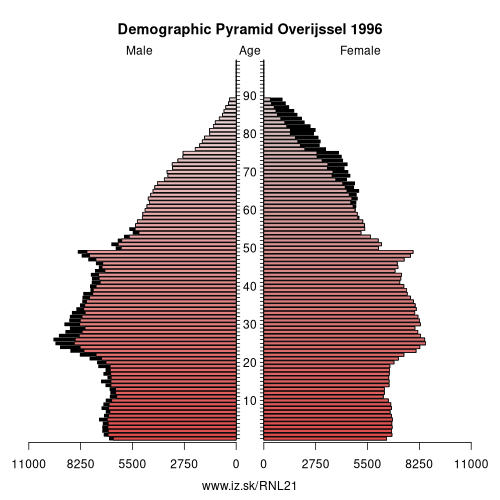
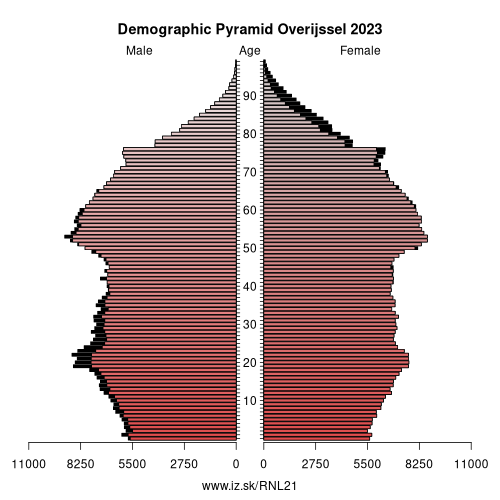
Demographics
| Indicator | Period | Value |
|---|---|---|
| Demographics | ||
| number of inhabitants | 2023 | 1.184333e+06 |
| population density | 2022 | 350.4 |
| old-age dependency ratio | 2023 | 31.9 |
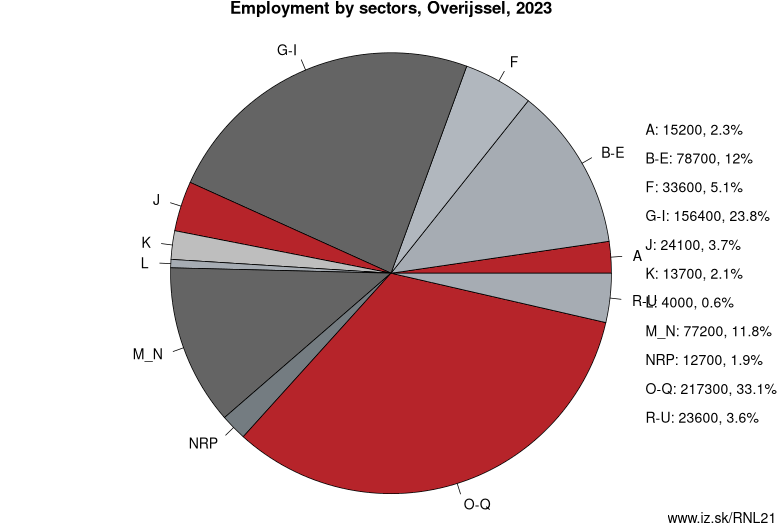
Employment by sectors, Overijssel
| NACE r2 | % | NACE r2 | % | ||
|---|---|---|---|---|---|
| A | 15.2 | 2 % | B-E | 78.7 | 12 % |
| F | 33.6 | 5 % | G-I | 156.4 | 24 % |
| J | 24.1 | 4 % | K | 13.7 | 2 % |
| L | 4 | 1 % | M_N | 77.2 | 12 % |
| NRP | 12.7 | 2 % | O-Q | 217.3 | 33 % |
| R-U | 23.6 | 4 % | TOTAL | 656.5 | 100 % |
Data for the period year 2023. Source of the data is Eurostat, table [lfst_r_lfe2en2].
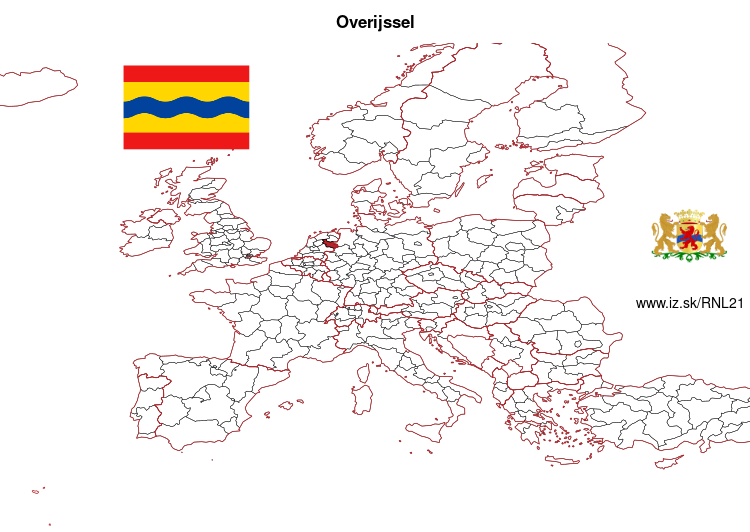
From Wikipedia: Overijssel ( OH-vər-EYE-səl, Dutch: [ˌoːvərˈɛisəl] (listen); Low German: Oaveriessel [ˌɒːvərˈiːsəl]; German: Oberyssel) is a province of the Netherlands located in the eastern part of the country. The province's name translates to „across the IJssel“, from the perspective of the Episcopal principality of Utrecht by which it was held until 1528. The capital city of Overijssel is Zwolle and the largest city is Enschede. The province had a population of 1,142,360 in 2015.
Geography
Overijssel is bordered by Germany (Lower Saxony and North Rhine-Westphalia) to the east, the Achterhoek region of Gelderland to the south, the Veluwe region of Gelderland and Flevoland to the west, and Friesland and the former moors of Drenthe to the north. Overijssel comprises three regions: Kop van Overijssel in the northwest, Salland in the centre of the province, and Twente in the east. Besides the capital Zwolle, other major cities are Almelo, Deventer, Enschede, and Hengelo.
To the southeast, the province's surface is mostly sandy, interspersed with small rivers such as the Regge and Dinkel and other brooks. In the northwest, the geology is dominated by sediments from the Overijsselse Vecht and clay. The northern parts were once covered by veen (bogs) which separated the dryer and more arable south from Drenthe and which have been exploited as fuel to a large degree. Only small patches survive today (Engbertsdijksvenen near Tubbergen, Witteveen (near Haaksbergen), and the Aamsveen (near Enschede).
Other: Eastern Netherlands, Overijssel, Gelderland, Flevoland
Neighbours: Münster Government Region, Friesland, Flevoland, Gelderland, Weser-Ems Government Region, Drenthe
Subregions: Noord-Overijssel, Zuidwest-Overijssel, Twente
Suggested citation: Michal Páleník: Europe and its regions in numbers - Overijssel – NL21, IZ Bratislava, retrieved from: https://www.iz.sk/PNL21, ISBN: 978-80-970204-9-1, DOI:10.5281/zenodo.10200164
 Share
Share Facebook
 Twitter
 News
News