-
- Objectives
- Team»
- Partners»
- IZ offers
- IZ in media
- Conferences
- Net income calculator»
- Population aging»
-
- Least developed regions»
-
- Material need benefits
- Meal allowance
- Counties of Slovakia
- Average wage and inflation
- Living and Subsistence Minimum
- Unemployment of Czechia and Slovakia
- NACE Classification
-
- Youth unemployment and NEET
- Minimum wage in EU
- Unemployment rates of different age groups
- Share of salaries on GDP
- Aggregate replacement ratio
- People at risk of poverty or social exclusion
- Employment of mothers of more than 3 children
- Percentage of employees ususally working on Sunday
- Long term unemployment
- Employment rate
- NEET
- Unemployment rate
- Unemployment rate - over 55 years
- Working hours on full time job
-
- Bratislava and surroundings
- Kopanice
- Danube river
- lower Vah river
- middle Vár river
- upper Nitra river
- lower Nitra river
- Mining cities
- Kysuce a Orava»
- upper Vah river - Liptov
- Spiš cities
- upper Hron river
- Juhoslovenská kotlina
- Košice fold and Torysa river
- upper Zemplín
- lower Zemplín
- EU regions
- NUTS3 regions of Slovakia
- LAU1 dataset
-
- Projects and activities
- Inclusive growth»
- Good work
- Social system – reality and vision
- Library
-
- Education of unemployed
- Young unemployed not taking part in education
- Proposal to change the system of education funding
- News»
- Contact
Haarlem - NL324
EU regions: Netherlands > Western Netherlands > North Holland > Haarlem


indicator | period | value |
---|---|---|
GDP per capita in PPS of EU average | 2019 | 91 |
number of inhabitants | 2021 | 230 734 |
population density | 2019 | 1762.1 |
old-age dependency ratio | 2021 | 31.8 |
more on wikipedia * more on wikidata Q9920 * on OpenStreetMap * Haarlem slovensky: NL324
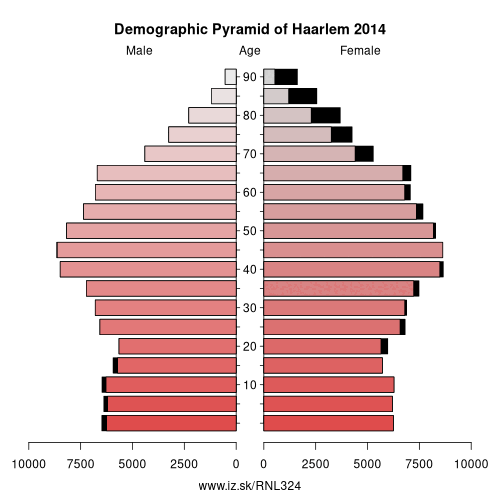
Composition of population according to age group, education and economic activity, Haarlem
age group | low education | middle education | high education |
---|
note: in thousands, according to labour force sample survey. P – total population, E – employed, U – unemployed, I – number of ecnomically inactive

From wikipedia:
Haarlem (Dutch pronunciation: [ˈɦaːrlɛm] (listen); predecessor of Harlem in the English language) is a city and municipality in the Netherlands. It is the capital of the province of North Holland and is situated at the northern edge of the Randstad, one of the most populated metropolitan areas in Europe. Haarlem had a population of 159,556 in 2017.Haarlem was granted city status or stadsrechten in 1245, although the first city walls were not built until 1270. The modern city encompasses the former municipality of Schoten as well as parts that previously belonged to Bloemendaal and Heemstede. Apart from the city, the municipality of Haarlem also includes the western part of the village of Spaarndam. Newer sections of Spaarndam lie within the neighbouring municipality of Haarlemmermeer.
Geography
The city is located on the river Spaarne, giving it its nickname 'Spaarnestad' (Spaarne city). It is situated about 20 km (12 mi) west of Amsterdam and near the coastal dunes. Haarlem has been the historical centre of the tulip bulb-growing district for centuries and bears its other nickname 'Bloemenstad' (flower city) for this reason.
other: North Holland, Alkmaar en omgeving, Zaanstreek, Groot-Amsterdam, Het Gooi en Vechtstreek, Kop van Noord-Holland, Haarlem, IJmond
neighbours: Groot-Amsterdam, Agglomeratie Leiden en Bollenstreek, Zaanstreek, IJmond
Suggested citation: Michal Páleník: EU regions - Haarlem - NL324, IZ Bratislava, retrieved from: https://www.iz.sk/en/projects/eu-regions/NL324
Similar articles
Navigation:
- Short news
- Local Administrative Units data open data
- Projects and activities
- European regions
- Random region: Germany, Bavaria, Lower Franconia, Würzburg district
Current statistics
December 2022: number of unemployed at the labour offices: 178143, of which 73275 are long term unemployed, unemployment rate 6.6 % (2.7 % long term unemployment)
Highest unemployment: Rimavská Sobota 20.8 % (13.0 %), Revúca 20.1 % (12.3 %), Kežmarok 18.0 % (8.9 %)
Lowest unemployment:: Bratislava V 2.6 %, Trenčín 2.8 %, Ilava 2.8 %, Bratislava I 3.0 %, Nitra 3.1 %