area in square km - year 2012
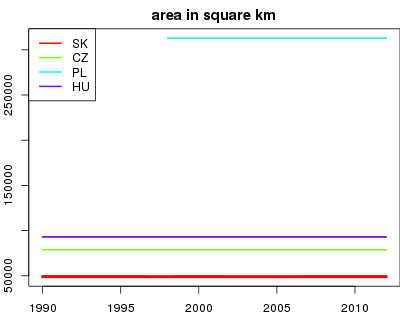
area in square km
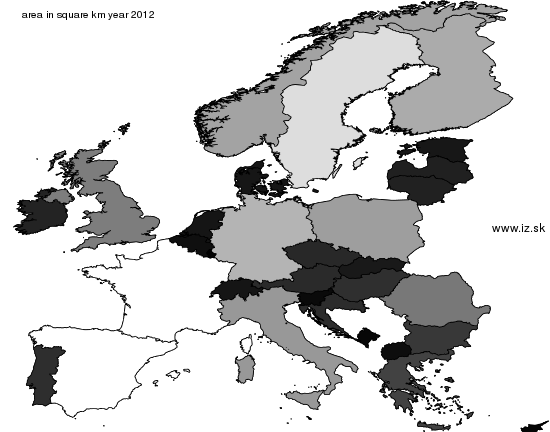
| order | code | Region | value |
| 1. | FR | France | 632 834 |
| 2. | ES | Spain | 505 991 |
| 3. | SE | Sweden | 438 576 |
| 4. | DE | Germany | 357 137 |
| 5. | FI | Finland | 338 432 |
| 6. | NO | Norway | 323 787 |
| 7. | PL | Poland | 312 679 |
| 8. | IT | Italy | 301 336 |
| 9. | UK | United Kingdom | 248 528 |
| 10. | RO | Romania | 238 391 |
| 11. | EL | Greece | 131 957 |
| 12. | BG | Bulgaria | 110 900 |
| 13. | IS | Iceland | 103 000 |
| 14. | HU | Hungary | 93 024 |
| 15. | PT | Portugal | 92 212 |
| 16. | HR | Croatia | 87 661 |
| 17. | AT | Austria | 83 879 |
| 18. | CZ | Czech republic | 78 866 |
| 19. | IE | Ireland | 69 797 |
| 20. | LT | Lithuania | 65 300 |
| 21. | LV | Latvia | 64 562 |
| 22. | SK | Slovakia | 49 036 |
| 23. | EE | Estonia | 45 227 |
| 24. | DK | Denmark | 42 895 |
| 25. | NL | Netherlands | 41 540 |
| 26. | CH | Switzerland | 41 285 |
| 27. | BE | Belgium | 30 528 |
| 28. | MK | Macedonia | 25 713 |
| 29. | SI | Slovenia | 20 273 |
| 30. | ME | Montenegro | 13 812 |
| 31. | CY | Cyprus | 9 251 |
| 32. | LU | Luxembourg | 2 586 |
| 33. | MT | Malta | 316 |
| 34. | LI | Liechtenstein | 161 |
Source: Eurostat; shortened variable name does not necessarily precisely describe contents of this v
Suggested citation: Michal Páleník: Europe and its regions in numbers - area in square km - year 2012, IZ Bratislava, retrieved from: https://www.iz.sk/en/projects/EU-indicators/area-in-square-km, ISBN: 978-80-970204-9-1, DOI:10.5281/zenodo.10200164
https://www.iz.sk/en/projects/EU-indicators/area-in-square-km
 Share
Share Facebook
 Twitter
 News
News